Solar Energy Production Forecasting and Prediction in Calgary, CA

This project applies data science for solar energy production in Calgary Fire Hall Headquarters by forecasting the trend of kWh output, predict the duration of energy acquisition and estimate the energy saved using daily temperature.

Seasonal Autoregressive Integrated Moving Average

Autoregressive algorithm that utilized moving average to consider the regular difference of past values in order to predict future observations.

Logistic Growth
Differential Equation Application

Quantitative approach in predicting energy acquisition duration using growth rate over time.

Data preprocessing,
visualization, and linear regression

Date time formatting, analysis using visualiztion, A/B hypothesis testing and regression kWh prediction.

Data Analysis Summary Findings

Exploratory analysis of solar energy production data set which visualizes observations.

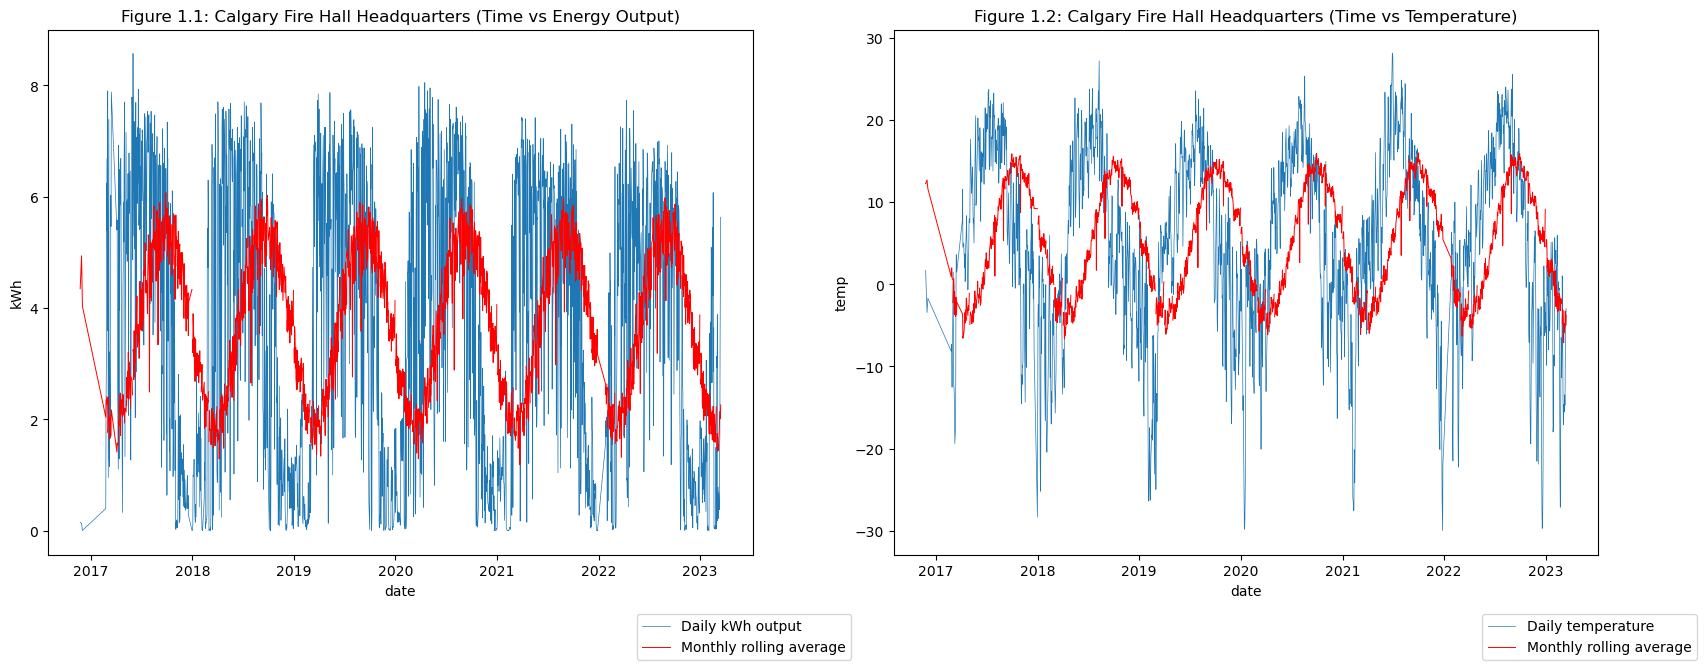
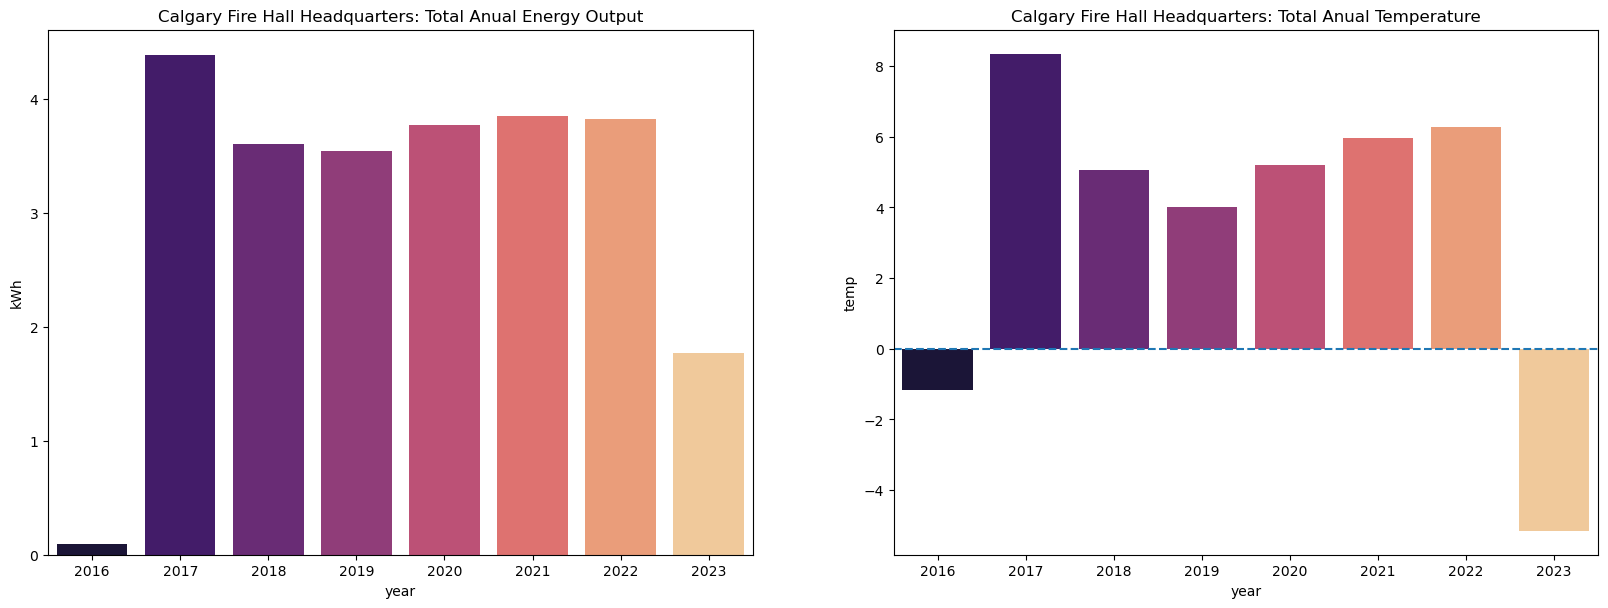
Total annual energy output and temperature

  • 2017 was the year with the highest temperature mean which also corresponds to highest total energy output.
  • A drastic decrease in temperature after 2017 and gradually increasing after 2019 onwards. 2023 shows negative temperature as data observed are acquired during winter season.

Time vs. temperature and energy output

  • kWh output and temperature are seasonal by increasing in the middle of the year and decreases as it enters and leaves the yearwhich signifies that our kWh output is correlated to temperature with maximum observations acquired during the summer and minimums are in the winter.
feature img feature img

SARIMA Forecasting

Autoregressive moving average approach of forecasting the trend of kWh per year. Applied autocorrelation techniques and ADF statistics for time-series stationary data testing.

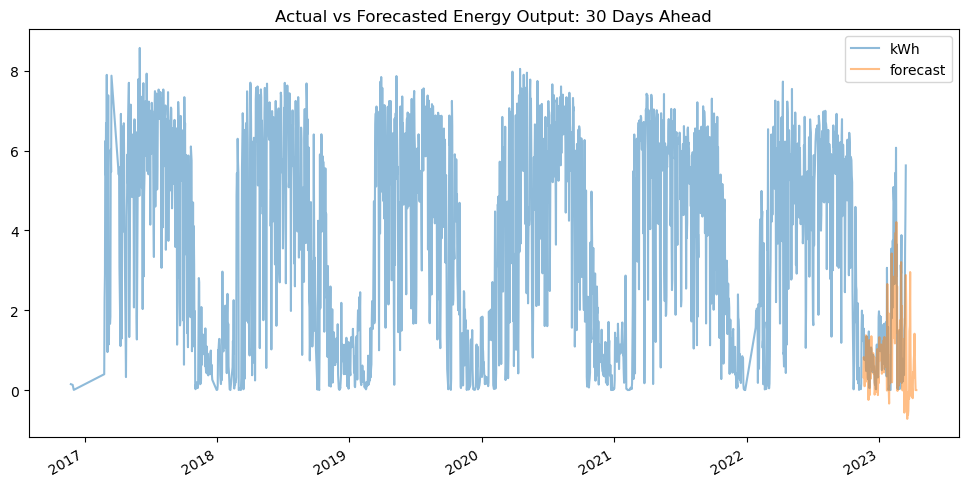
Actual vs. Forecasted Energy Output

  • With a standard deviation error of 0.019 and a p-value of 0.005, our time-series data is stationery which also shows a good fit for capturing the trend of daily temperature.
  • The plot shows an upward trend of kWh output as progresses further into year 2023. 30 day forecast shows an average of 1.5 kWh daily output.

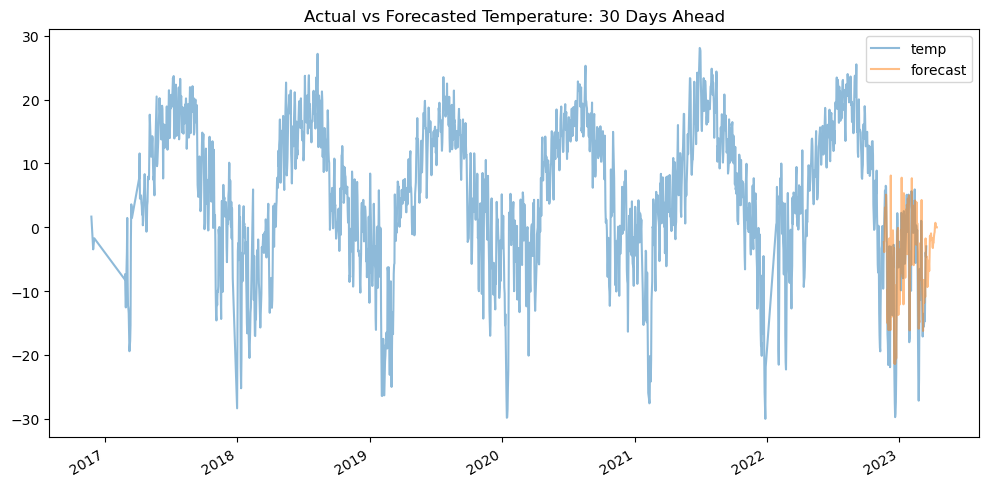
Actual vs. Forecasted Daily Temperature

  • With a standard deviation error of 0.018 and a p-value of 0.004, our time-series data is stationery which also shows a good fit for capturing the trend of kWh daily output.
  • The plot shows an increasing daily temperature coming from a negative value as the months of 2023 progresses. 30 day forecast shows temperature values passing the zero threshold.

500kWh energy acquisition duration

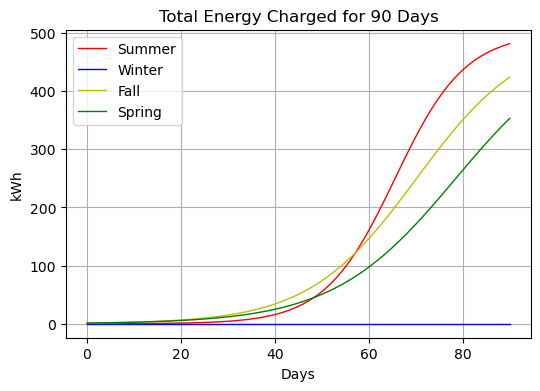
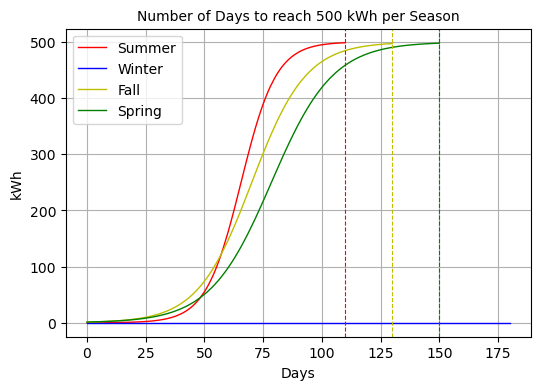
Assuming we have a solar panel system with a maximum capacity of 500 kWh, we could determine how long would it take to charge this for at least 95% during the months of rise and fall of temperature using logistic growth.

90 days solar energy acquisition kWh output:

  • 480kWh output during summer season.
  • 420kWh output during fall season.
  • 3500kWh output during spring season.
  • Stagnant output during winter season.

Number of days for 500kWh energy acquisition:

  • Approximately 110 days to charge 500kWh of solar energy output during summer.
  • Approximately 130 days to charge 500kWh of solar energy output during summer.
  • Approximately 150 days to charge 500kWh of solar energy output during summer.
  • Stagnant output during winter season.
feature img feature img
feature img

kWh output prediction

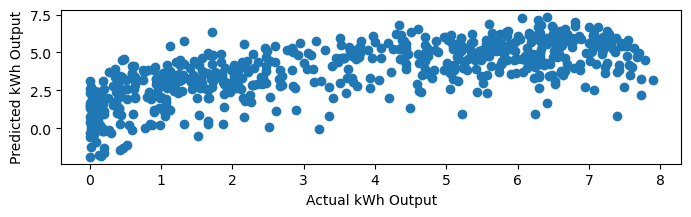
Applying linear regression to predict the kWh output of the solar energy production based on temperature.

Mathematical syntax:

  • y = 0.1602177x1 + 2.93125503

Sample predictions with R-squared score of 47% and Mean absolute error of 1.5:

  • At 29 average hourly temperature, we can expect 7.57756845 kWh output.
  • At 13 average hourly temperature, we can expect 5.01408518 kWh output
  • At 6 average hourly temperature, we can expect 3.89256126 kWh output