Exploratory data analysis using visualization and observation outliers handling.
Quantitative approach in formulating the mathematical syntax that allows individuals to compute insurance based on personal details.
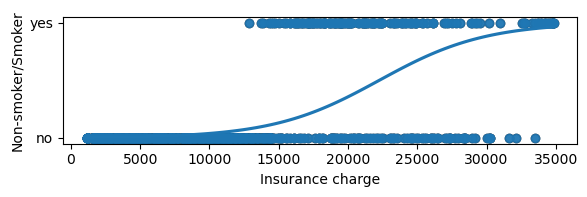
Probability extraction of the classification model in order to determine the limits of insurance cost.
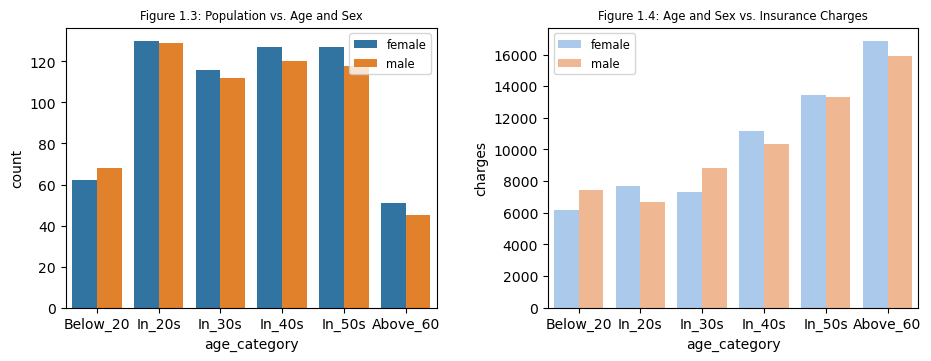
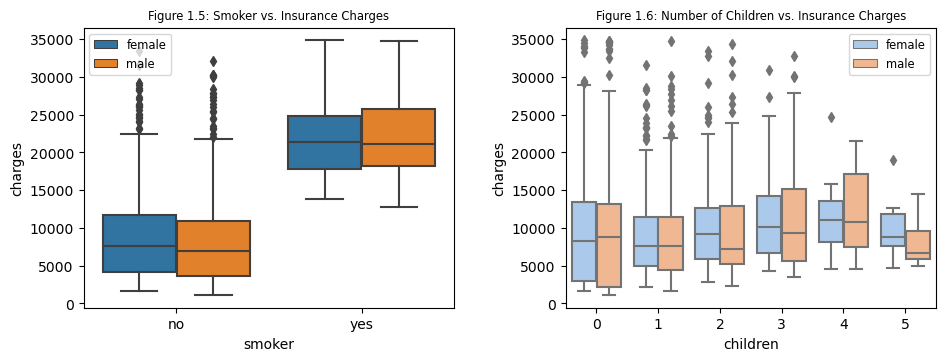
Exploratory analysis of medical insurance data set which visualizes observations.
Insights extracted from data visualizations.
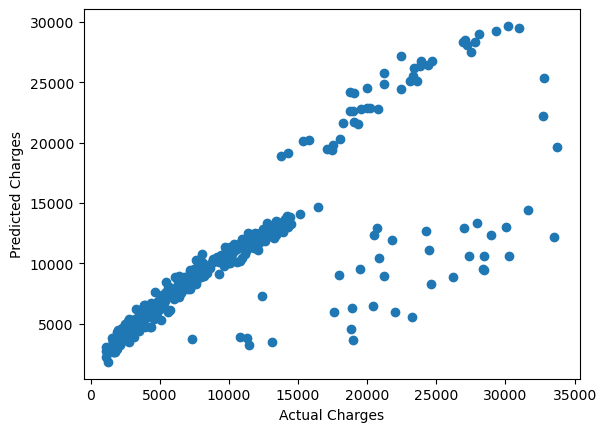
Using linear regression to formulate the cost of insurance mathematical model considering the attributes provided by each individual.
Predictive Mathematical Model
y = 220.60x1 - 204.26x2 + 72.78x3 + 369.42x4 + 15919.58x5 - -426.05x6 - -2555.33
With a correlation value 0.62, smoking causes a major drag in our insurance cost. With this in mind, we would like to know what are the minimum and maximum value of being a smoker in contrast to non-smoker.
Using logistic regression, we can say the following conclusions::